5. Reboot Analysis - WDOG
This section provides a brief description of the watchdog (WDOG) mechanism as implemented in the DA1468x family of devices. It describes the tools that can be used to deal with watchdog exceptions, explains how the SDK handles watchdog exceptions, and demonstrates a real use case of a watchdog exception, including all the steps that need to be followed for copying with the exception.
5.1. Introduction
Most embedded systems need to be self-reliant. It’s not usually possible to wait for someone to reboot them if the software hangs. A watchdog mechanism is a special hardware timer that can be used to automatically detect unexpected system behaviors during software execution. The DA1468x family of devices incorporates an 8-bit down counter drived by a 10.24 ms clock pulse, resulting in a maximum 2.6 seconds time-out. The embedded software selects the counter’s initial value, by default this is set to 255, and periodically restarts it indicating that the application is up and running. If for any reason the firmware execution gets stuck, the watchdog timer is not updated and therefore expires after a time. Upon its expiration, and depending on the system configurations, either an NMI exception or a WDOG reset is issued to recover the system. By default, the system is configured so that an NMI interrupt is issued when the WDOG reaches a zero value.
Note
An NMI (Non Maskable Interrupt) is similar to an IRQ interrupt but it cannot be disabled by control registers and therefore its responsiveness is guaranteed.

Fig. 26 Watchdog Functionality as Configured by Default
The way the SDK handles watchdog related events depends on whether the application is built in development or production mode.
- In development mode (enabled by default), the SDK freezes the watchdog operation, stores the system status in a predefined retained location in memory (SySRAM), and then halts CPU operation. This allows the developer to attach a debugger, extract all the information stored in that memory area, and eventually identify the reason for the fault.
- In production mode, halting system operation is not practical as it would require the user to get involved with
debugging and recovery of the system. Instead, the system status is stored in a dedicated retained
area (
nmi_info) in SySRAM memory and after a while the watchdog mechanism triggers a hardware reset, which recovers the system.
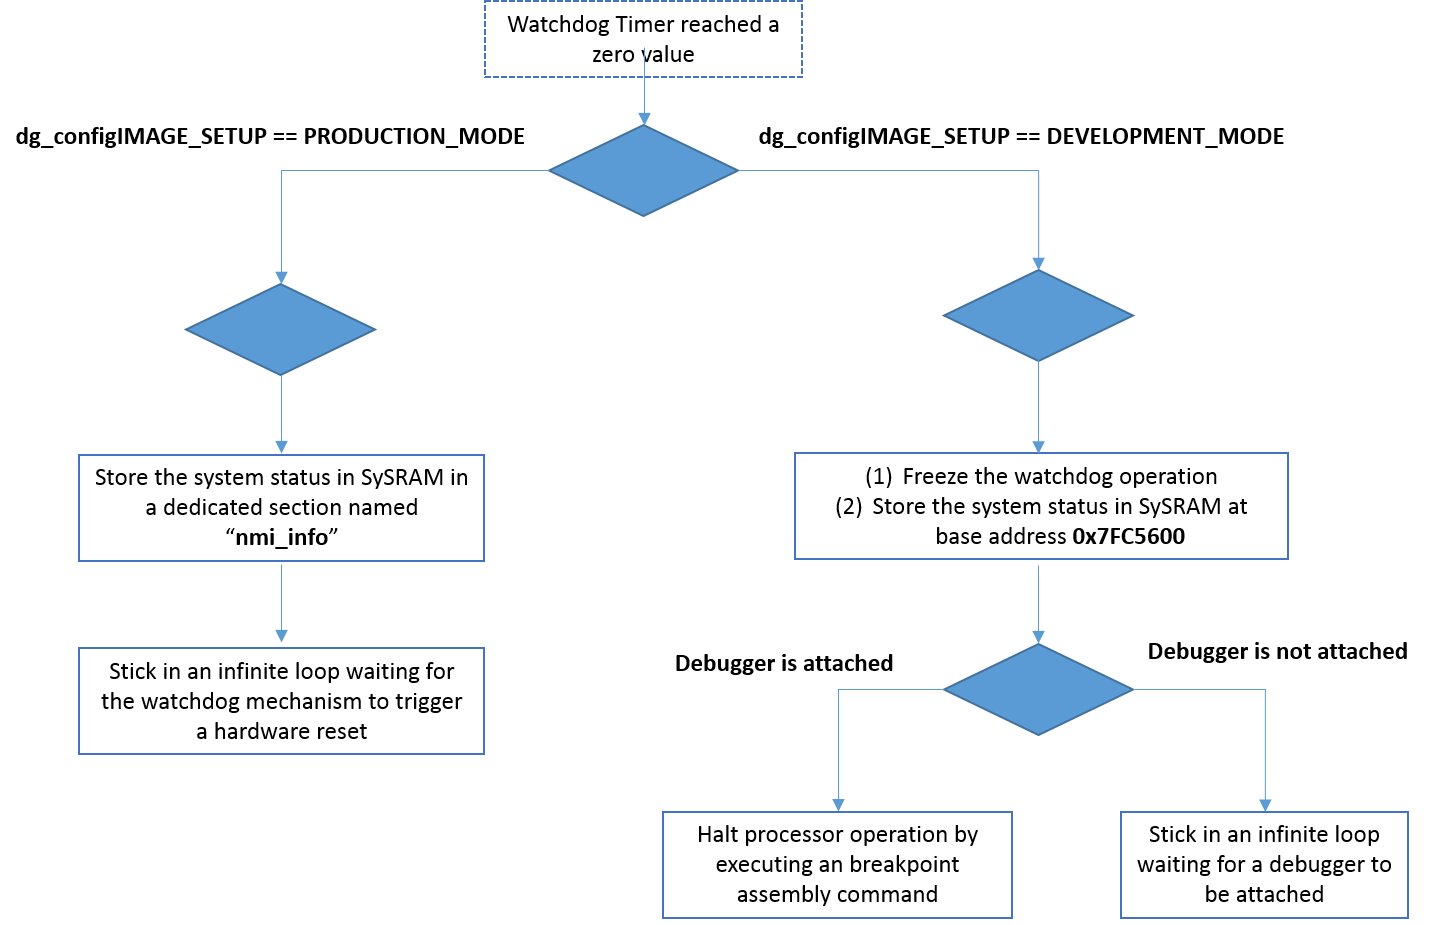
Fig. 27 SW FSM of the Watchdog Exception Handler
5.2. Manually Triggering a Watchdog Exception
The following real use case demonstrates expiring the watchdog timer and then identifying the cause of the fault.
- Make a copy of the freertos_retarget sample code found in the SDK of the DA1468x family of devices. If this step has already been executed in previous sections do not repeat it. For information on how to create a new project, see Create a New Project in the Starting a Project tutorial.
- In the
main.csource file, insert the following code which triggers a watchdog expiration. This function traps the code execution in an infinite loop without updating the watchdog counter value. This results in the counter’s expiration as soon as it reaches a value equal to zero.
void trigger_wdog(void)
{
        /*
         * Remain here until Watchdog Timer reaches a zero value and
         * an NMI interrupt is triggered.
         */
        for (;;) ;
}
- In the main task of the application,
prvTemplateTask, call the aforementioned function within its main loop, for instance:
 /* Place this task in the blocked state until it is time to run again.
    The block time is specified in ticks, the constant used converts ticks
    to ms.  While in the Blocked state this task will not consume any CPU
    time. */
 vTaskDelayUntil( &xNextWakeTime, mainCOUNTER_FREQUENCY_MS );


/* Trigger a watchdog exception deliberately! */
 trigger_wdog();

 test_counter++;
- Enable the watchdog mechanism by declaring and setting the correct value to the
dg_configUSE_WDOGmacro. To do this, add the following macro definition in theconfig/custom_config_qspi.hheader file.
Note
Before proceeding with this step check whether or not this macro has already been declared, so that to avoid duplicate declarations.
/* Enable WDOG */
#define dg_configUSE_WDOG                       (1)
- If required, the developer can modify the initial WDOG counter value from 0xFF which is the default and the
maximum allowable value. To do this, add the following macro definition in the
config/custom_config_qspi.hconfiguration file.
#define dg_configWDOG_RESET_VALUE XXXX
- Build the project in Debug mode (for the DA14681 SoC this is done by selecting the
DA14681-01-Debug-QSPIbuild scheme) and burn the generated image to the chip.
Note
Debug mode is preferred over Release when a debugging session is to be performed, as stepping the code is a straightforward task. In Release mode, the source code is built using optimizations, thus making tracing a more complex task.
- Press the K2 button on Pro DevKit. This step starts the chip executing its firmware. After a while, the watchdog will expire.
5.3. Dealing with a Watchdog Event
This section provides the steps required to identify the cause of the fault.
Initiate a debugging session by selecting the ATTACH mode. Upon switching to Debug view pause the code execution by selecting Suspend.
Program execution should now be stuck in an infinite loop under the
hw_watchdog_handle_intNMI handler.

Fig. 28 Watchdog Handler Function
- The watchdog handler function provides the whole stack frame when the watchdog timer expired. The values of
registers R0 to R3, R12, LR, PC, and xPSR are stored in memory position
0x07FC5600. To view the contents stored in memory, select the Memory Browser tool (1) and enter the base address where the stack frame is stored (2). Enter either the physical memory address value or the name of the corresponding macro, that isSTATUS_BASE.
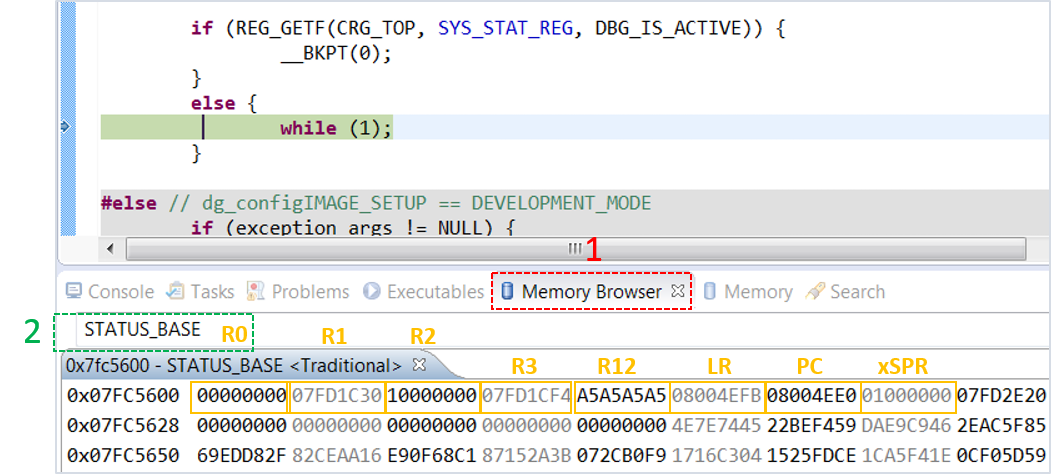
Fig. 29 Probing the Stack Frame Captured upon a Watchdog Event
The most useful information is held in the Program Counter (PC) and Link Register (LR). Together with the Disassembly View tool, this can be used to identify the exact assembly command that caused the error.
To examine the command pointed to by the PC register value, select the Disassembly window (1), enter the value of the PC (2), and press enter. Then locate the command pointed to by the PC register (3) (displayed both in C and Assembly language).

Fig. 30 Probing the Contents of the Program Counter
- Similarly, examine the instruction pointed by the Link Register. Since the code execution is trapped in an infinite loop within a function, the LR should point to that function.

Fig. 31 Probing the Contents of the Link Register